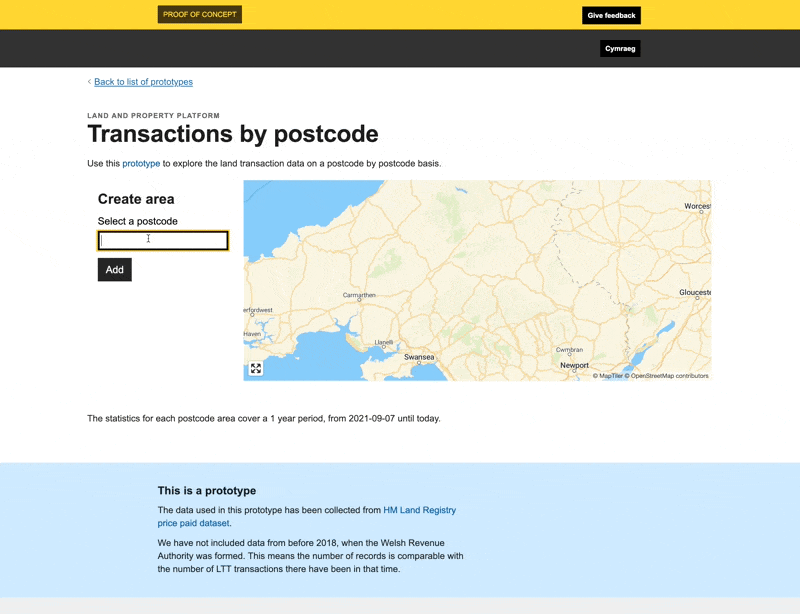
LTT statistics by postcode
With this prototype, we started to flesh out some ideas for a policy explorer tool.
We think policy tools and services will be helpful for policy teams devising, assessing and implementing policies. They will also be helpful for other parties who need to understand the impact of a policy or change to a policy.
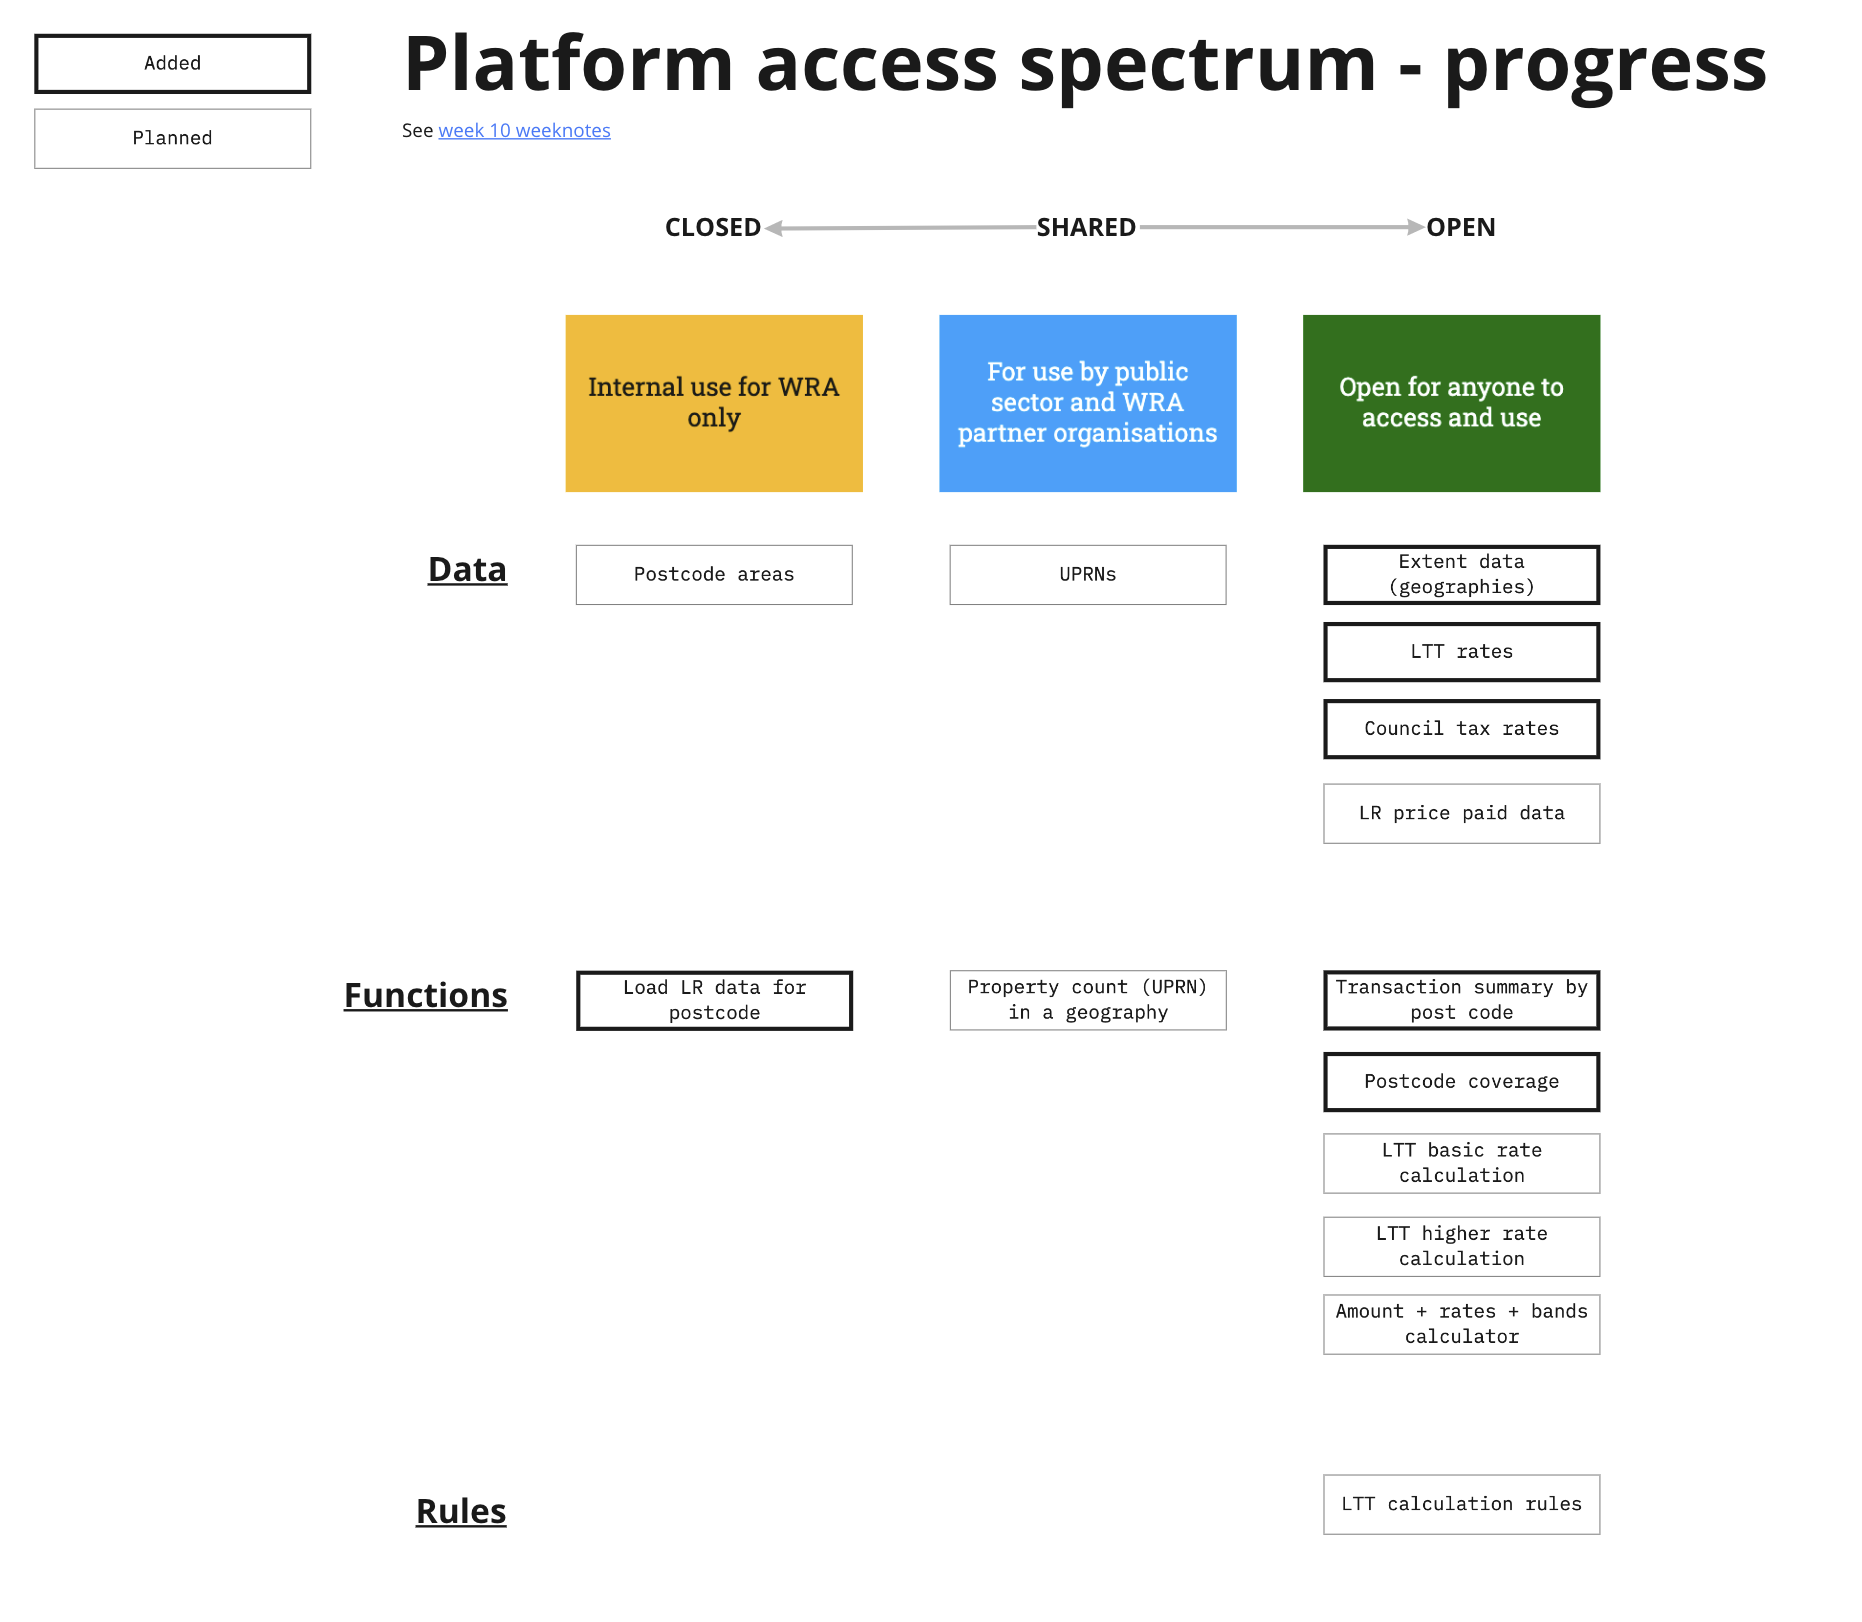
A land and property tax platform should make it easier to make these types of services. To help service builders the land and property tax platform needs to provide more capability. As well as letting users access complete datasets, it needs to let users access cuts and subsets of the data.
We also started thinking about what the platform should do when its not possible to expose all the raw data. We will need to restrict access to data containing anything sensitive or private. However, we know platforms provide most value when they are open and have more people using them. Therefore it is important we try to keep everything we can open, and in cases where we need to restrict access to the raw data we should be asking “What parts of the data can we expose or what functionality sitting on top of the data can we expose?”
We need to figure out where the data, functions and rules sit along the “platform access spectrum”. What should be restricted and what bits can we open up to a larger set of users?
We wanted to demonstrate this with a real-world example.
In this case, the platform reveals data allowing someone to assess the impact of the Land Transaction Tax policy in an area, but it doesn’t expose all the individual transactions - these contain sensitive information. Instead, it provides summary transaction data for post code areas.
This allowed us to build a prototype that might help local authorities who need to assess the potential impact in potential specially designated second-home-holiday-let areas.
What we learnt / takeaways
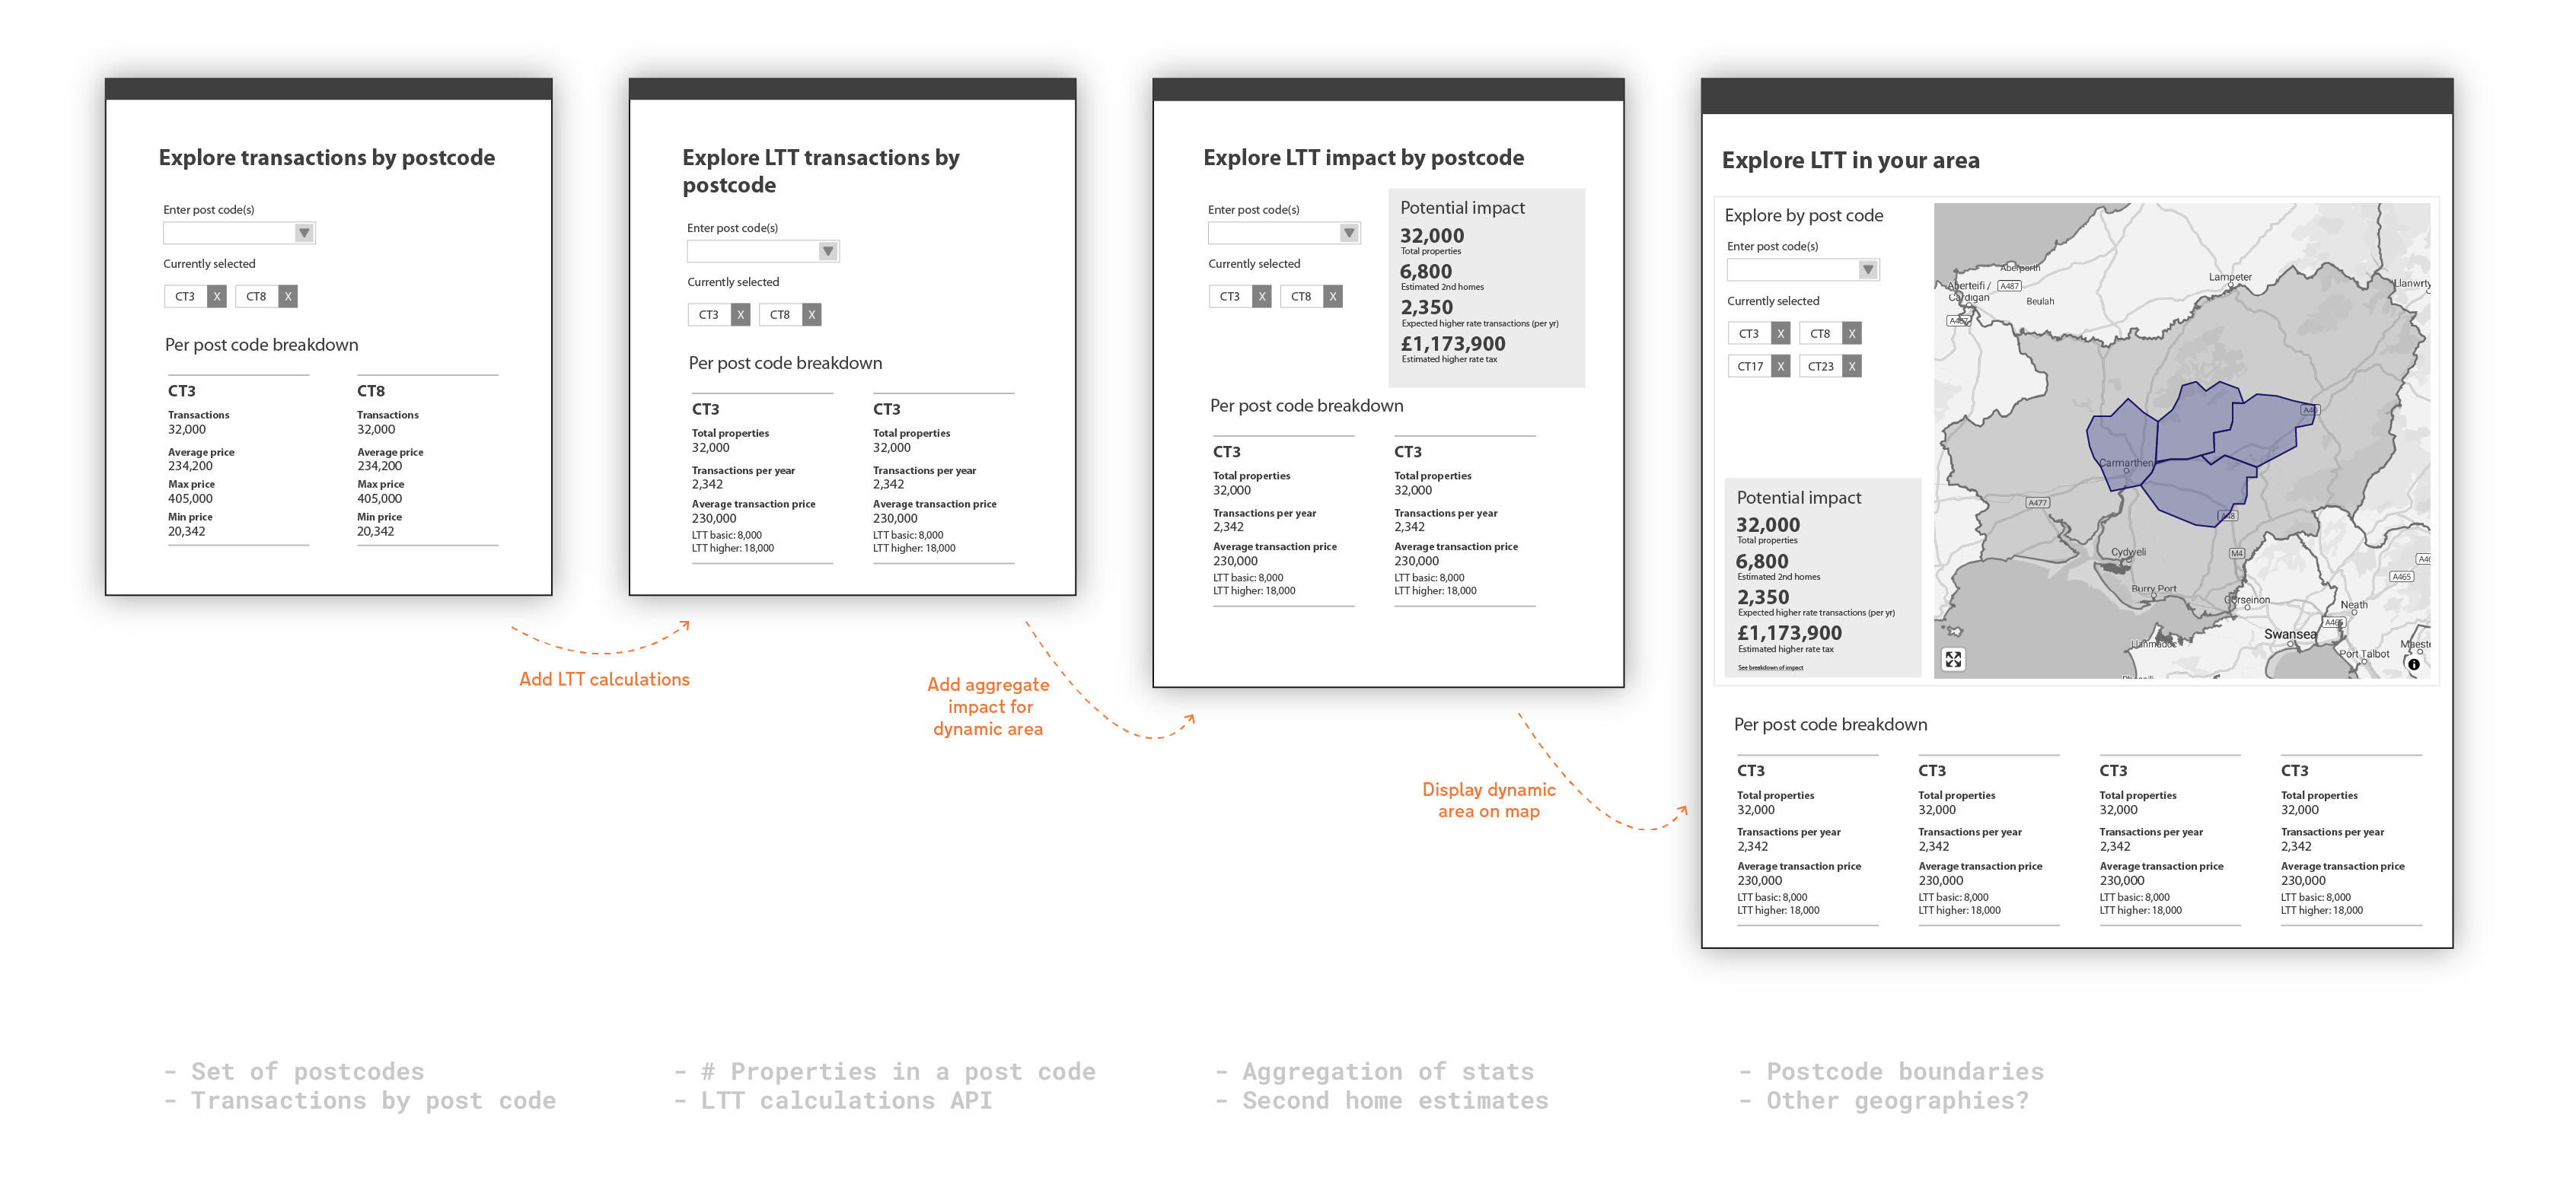
This prototype was an amalgamation of what we’d learnt from previous prototypes. It showed we could we bring together what we’d experimented with so far and make something of real value. Next step is take it out to users and iterate based on their feedback.
Showing things leads to feedback
This was a nice example of why we show things. Some colleagues from Welsh treasury joined our show and tell and seeing the demo they gave us some very helpful feedback about other data they’d find useful in this type of tool. The data they mentioned, such as population, wasn’t on our radar so it was great to get this feedback.
We built this prototype over a number of iterations. However, we produced something usable at each step which meant we could show it to people and get some feedback as we worked on it.
Maps should be a progressive enhancement
This was a good example of using maps as an enhancement. We created a working prototype without the map, then added one to help users visualise the areas they were creating, improving the overall experience.
Issues to resolve
Whats the privacy risk?
A potential interesting challenge cropped up with this prototype.
We have limited access to the transaction data by only providing summaries for an area. However, there might be situations where someone could draw two very similar areas and work out what applies to the difference. It might even let someone pinpoint a single transaction.
This isn’t a problem for this prototype because we used the publicly available Land Registry data. However, it is a good reminder that we need to careful consider the risks associated with any data we make available; raw, derived or summary data.
Using postcode data is difficult
They have a restrictive license so what you can do with them is limited.
Using the higher level postcode areas might not be fine grained enough for users who need to create areas for specific purposes.
Postcodes change over time.
What should we do when there are errors in the data?
We experienced some issues with the data. Some postcodes that are now no longer used were still showing up in the data. For example, we expected to see CF1 in the complete dataset but transactions dated 5 years after it was no longer a used postcode still had the postcode as CF1.
We know this must be an error however what should we do with it? How should we handle issues with the data? Should we try to fix it? Should we feed it back to the owners of the data? And what should we do if we have fed it back but the data hasn’t been corrected? These are the sorts of questions we’ll need to answer when designing how to operate the platform.
Seeing this error was a good reminder that it is not as simple as grabbing data and adding it into the platform. We need to think about the lifecycle of the data we use - data changes over time so how will we maintain the data in the platform so that it reflects these changes?
Using the whole postcode dataset slows the map down
To allow users to select postcode areas on the map we have to first load the 103000+ postcode boundaries. This is very expensive and slows the prototype down. There are ways to improve this, such as creating a derived dataset of higher level post codes. So a boundary for LD3 instead of a boundary for LD3 8RD, LD3 9RG, etc. We can also use tileservers instead of loading all the GeoJSON in one go. These are solutions we can explore when we build out the tool further.
Need to add a reset button
The URL updates as users select and deselect postcodes. This makes it easier to share areas with other users. However, the tradeoff is that it is harder to get back to the empty (no postcode areas selected) state. Users have to deselect each postcode. We should add a button that does this for users.
Weeknotes
Each week we share a short update on what we’re learning, along with links to things we think are interesting or relevant.
Blog
- The technical architecture
- Policy challenges
- Every day's a school day – lessons learned from the land and property platform
- Why are inaccuracies creeping into addresses on the Land Transaction Tax return?
- How a map can paint a bigger picture
- Summarising the Proof of Concept
- What we learned about users
- How we used weeknotes
- What we've learned about working in the open
- What do we mean by a data platform?
- Welcome
Prototype
We built a number of prototypes to test our assumptions, platform capability and ideas.